This is a collection of some of the different projects I have made or worked on over the years.
wxPyMuPDF
Currently, I have a job where I am looking at a lot of pdf files. I never really realized how bad the options are for viewing a lot of pdf data quickly, so I set out to creat my own reader.
Some of the things that I wanted to include were:
Unfortunately, I was told that I would not be allowed to install this new PDF reader on my work computer, so this project has pretty much been abandoned. It's possible that I'll get back to it at some point, but for now, my motivation is completely killed on this one. You can see the code on my github page: https://github.com/ClayShoaf/wxPyMuPDF
WeatherMapper
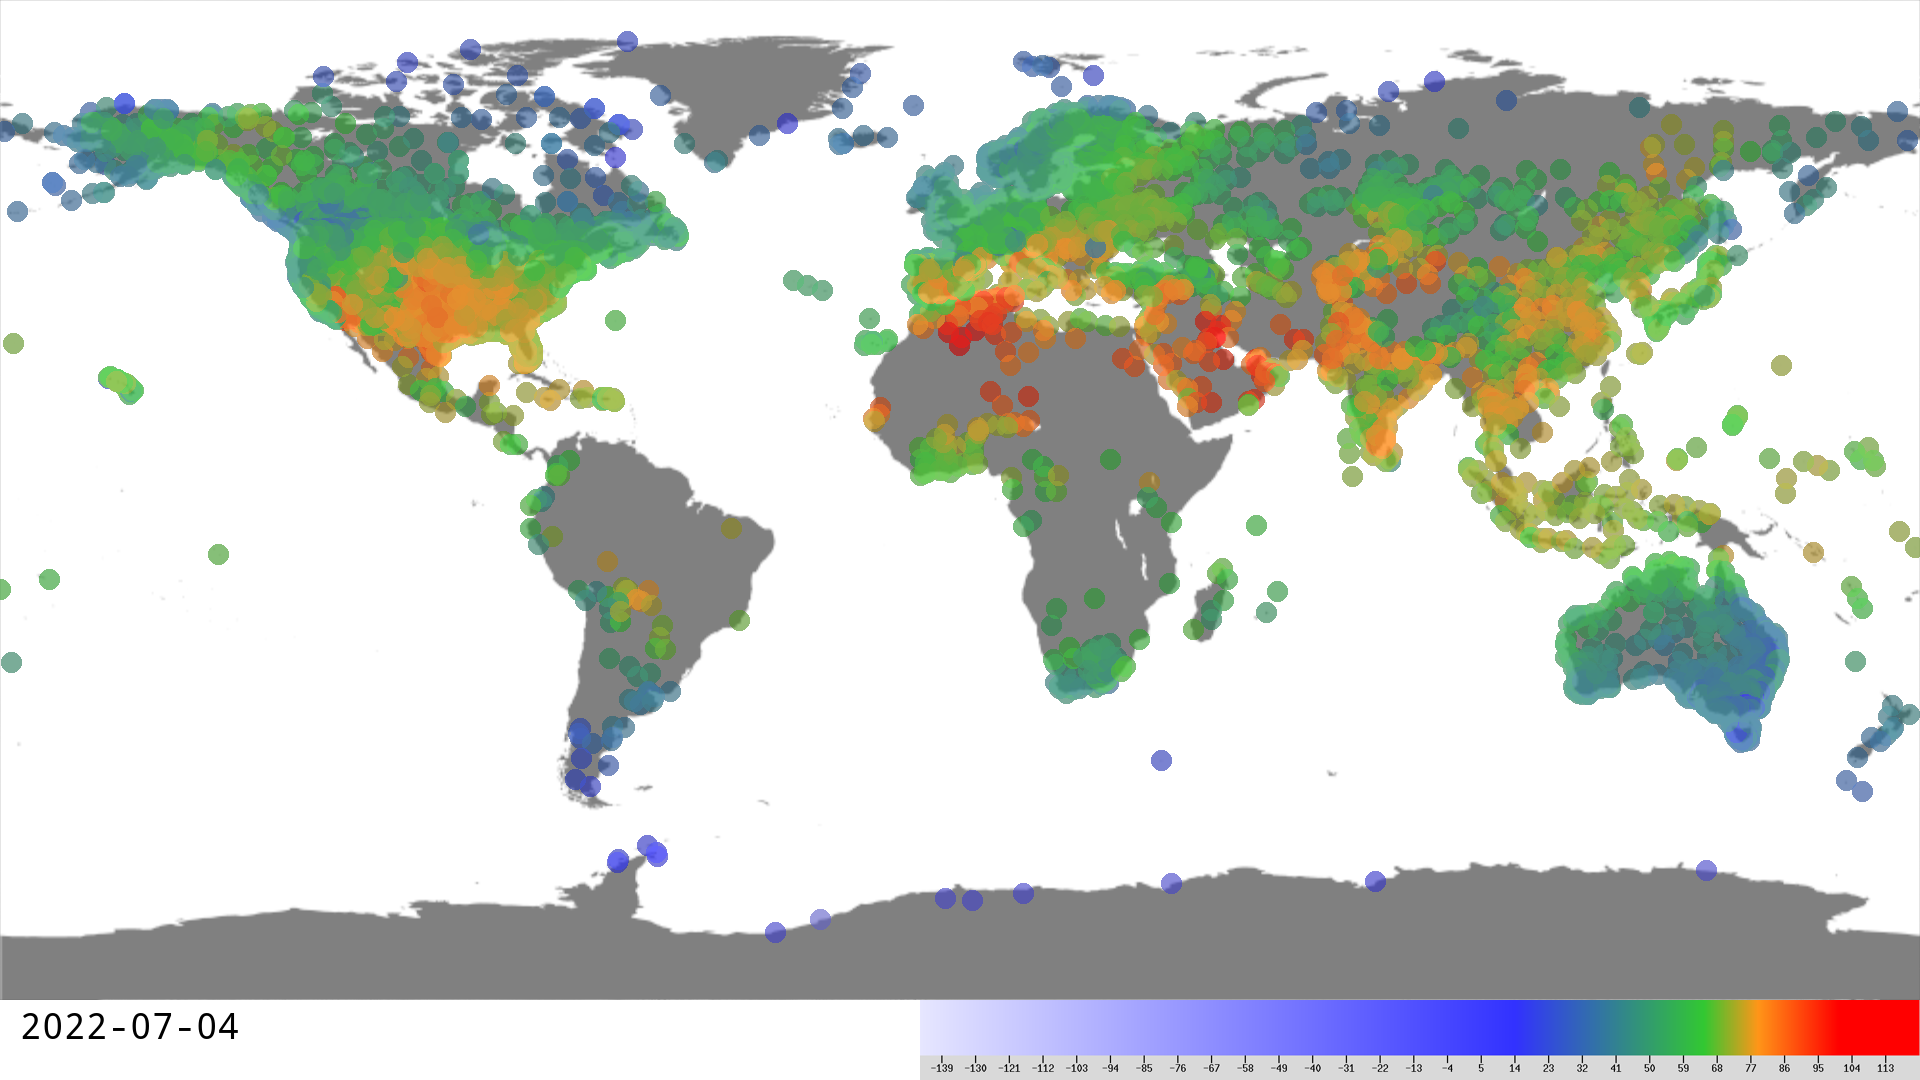
This started because I couldn't find a visualization for historical weather data. I wanted to see what the temperatures looked like for all of the weather data that we have. I took all of the Global Historical Climatology Network weather data and extracted the maximum temperature for every day from every station avalable and plotted them on a map with a corresponding color from a color key that I created. I exported every frame as a png file and then made a video from all of these frames with ffmpeg. This took an exceptionally long time and downright abused my hard drive.
I figured there had to be a better way, so I started looking into different ways of displaying visuals with python. I eventually settled on pygame because it has a large community and it uses SDL so I can run it on my very old laptop if I need to. I also looked into ways of handling large datasets. I was somewhat familiar with numpy from working with AI software, but I wasn't really clear on what it was. Through this project, I have become more familiar with numpy as a result of learning about pandas. Pandas is awesome and it is doing the heavy lifting when it comes to reading and manipulating these dataset. I am currently working on a more general program that can easily make charts and graphs based on any dataset that you decide to load. You can find my current progress here: https://github.com/ClayShoaf/weather-mapper

OpenCPI
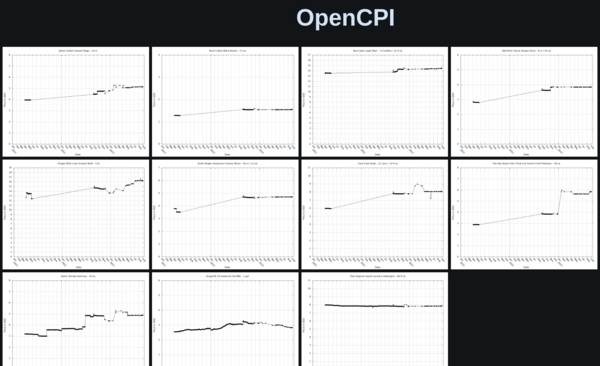
I wanted to see if I could make my own consumer price index. Unfortunately, Kroger's API access is very limited, so in order to get the amount of prices I was looking for, I had to severely limit the number of Items I was tracking. Every morning, it pulls the prices of each SKU from 100 different Kroger stores, spread out across the country. It then averages that price and adds it to the chart. I have been tracking them since 2021. There was a bug in the code that went unnoticed for a long time due to me working overtime at my day job and not really paying attention to it for a while. I found the root cause and it has been working well ever since. The charts can be seen at opencpi.xyz. It's not the prettiest website, but I never really intended on putting it out to the public. The site mostly runs with shell scripts.

Installation Patch for Text Generation WebUI
The most popular software for running Large Language Models locally (oobabooga/text-generation-webui) was having issues installing on Windows, so I made a little bandaid solution that would fix all of the bugs until it could be implemented officially in the main repository. The bugs have since been fixed, but the archive of my code can be found here. The owner of the official repository was appreciative enough to give me a shout out in the readme.md of the main repository for a while (as of this writing, it is still on the main page). I thought that was pretty cool.
X/Y Grid Generator for Text Generation WebUI (WIP)
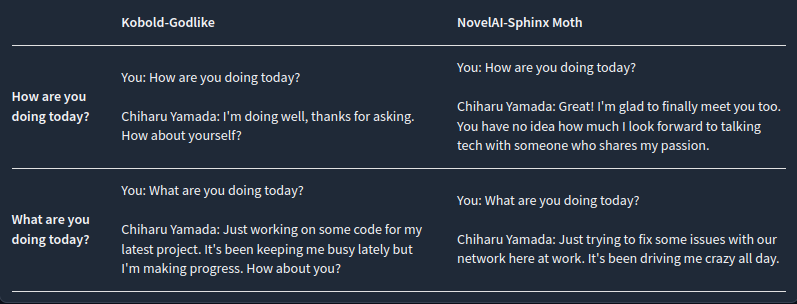
I was working on a script that would create grid of different outputs for Large Language Models. This is helpful for when you are trying different models or different settings and you want to easily see what kind of effect those changes will have. The grid generator was working great, the last time I worked on it, but there was a bug in some upstream software that was not allowing me to add the final feature that I wanted to add (LoRA support). The bug took a long time to be resolved, so my work on this project stagnated. Recently there seems to be a solution, but it will take me a little bit of time to get my head wrapped around this project again, as there are a lot of moving pieces and I'm just doing this as a hobby in my free time.

Stock Volatility Data Visualization
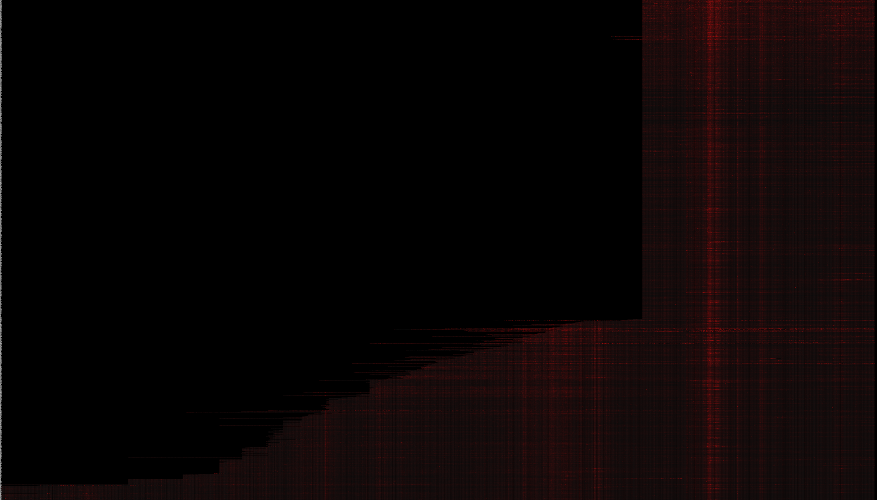
I like trying to visualize large amounts of data. I found a dataset of the daily stock prices for 7,196 stocks dating back to 1970. I used this data to make a chart that shows the daily volatility of every stock. Each Horizontal pixel in this image is one day's stock volatility. The brighter the color, the more volatile the stock was that day. I wrote this program in python. The original image had all of the stocks, but that was way too big an unwieldy. This image includes only the 1,000 stocks with the most data. If you start with zero on the x axis, the date will be January 1st, 1970. Warning, this is a ~7MB image file.

Winstmas Games Animation
This is an animation I made for a friend of mine's video podcast. He provided a static image and I made it move. I have played around a lot with After Effects, but I had never made an animation like this one before this project. It took about 8 hours to make.